Other Visualization Packages in Python
There are a number of packages which interact with matplotlib, or work on their own, to extend python’s plotting abilities.
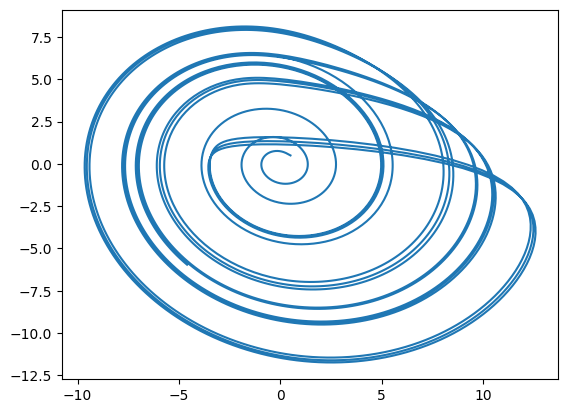
We’ll use the Roessler chaos model to generate data for plotting in this notebook:
%pylab inline
import pysd
model = pysd.read_vensim('../../models/Roessler_Chaos/roessler_chaos.mdl')
res = model.run()
Populating the interactive namespace from numpy and matplotlib
Seaborn
Seaborn is a
package which aims to make plots more stylish. To use it, we simply have
to import it into the python environment and continue plotting as with
matplotlib. Seaborn provides a host of new functions and
customizations that are illustrated
here.
import seaborn
plt.plot(res['x'], res['y']);
MPLD3
MPLD3 translates matplotlib plotting syntax into a d3-rendered interactive javascript object.
Note that in the figure below, zoom and pan tools allow you to interact with the image.
Syntax here is very similar to before, with the addition of a call to
the display function. For further examples see the mpld3
gallery.
import mpld3
plt.plot(res['x'], res['y']);
mpld3.display()